Extracting metrics from IIS logs
saving your time: Through the log file I want RED metrics from my IIS
If you’re from the new generation and have never worked with IIS, let me introduce you to this legendary web server. It’s a secure, easy-to-manage, modular, and extensible platform for hosting websites, services, and applications (by Microsoft). That said… IIS isn’t exactly the hottest thing around these days and there are reasons for that 💥. But, as the old saying goes: you don’t have to like it, but you should at least learn to live with it!! 😆
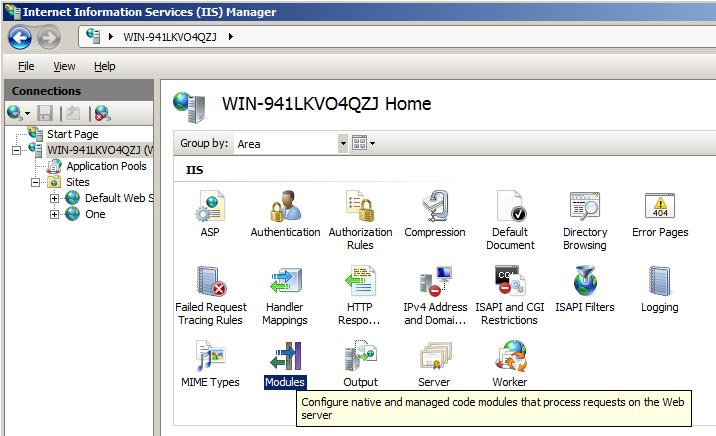
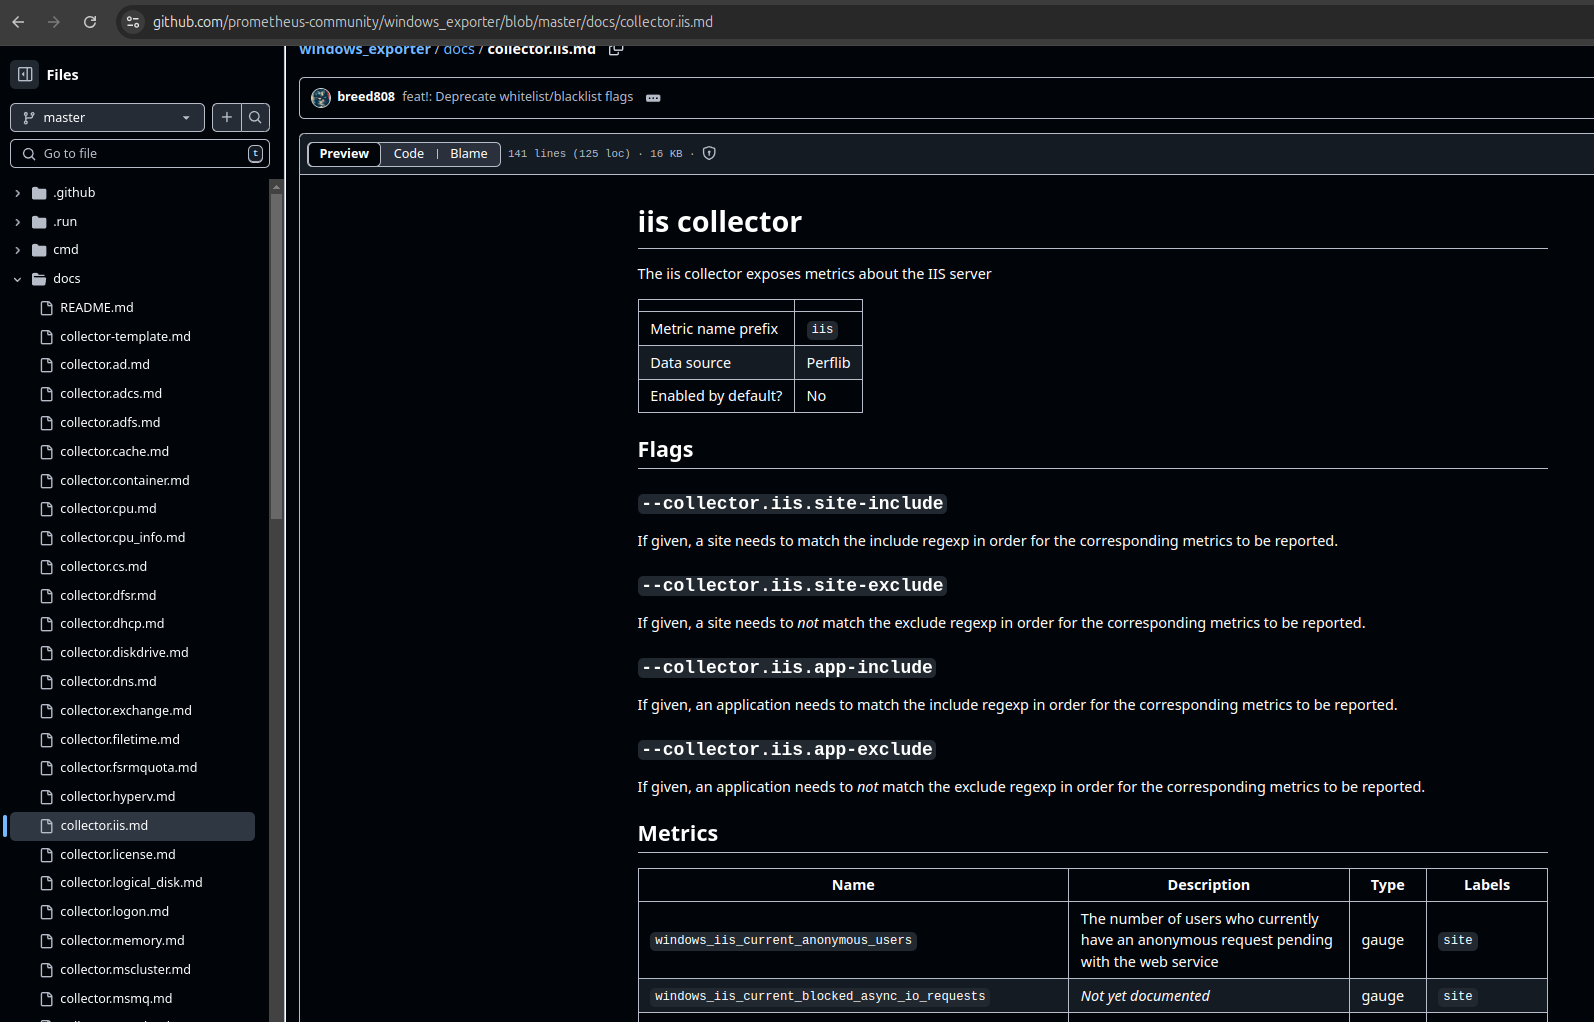
My journey began when I was tasked with understanding the behavior of an IIS server, making it observable, and setting up alarms for potential issues. The first step was to install windows_exporter, which includes the IIS collector. While it provided many valuable metrics about IIS, it wasn’t exactly what I needed. What I was really looking for were RED metrics, more focused on HTTP responses from IIS. I researched some repositories but couldn’t find anything satisfactory.
Below is the conventional solution I was already using 👇
I spent some time exploring IIS and realized that the only data source that truly met my needs was the logs. Although it wasn’t the most elegant solution, using them as a data source solved my problem and, of course, created other challenges.
The log files contained the request path, the method used, the status code, and the response time. These were exactly the pieces of information I needed. Using this data, I identified key metrics.

First, I developed a Python script that parsed log files and transformed them into metrics exposed in HTTP server format, following the traditional model. When I tried to adapt the solution for Windows, I didn’t necessarily want to have Python installed on the machine, and when using PyInstaller, I faced many frustrations.
I decided to rewrite the code in Go, using the same logic as before. I built it as a compiled binary (GOOS=windows GOARCH=amd64 go build -o …), and initially, everything looked promising. However, when I turned it into a Windows service, I ran into a series of issues. Despite trying different approaches, I couldn’t get my Go application to handle Windows syscalls properly. It was a frustrating experience, but in the end, I chose to explore a different solution.
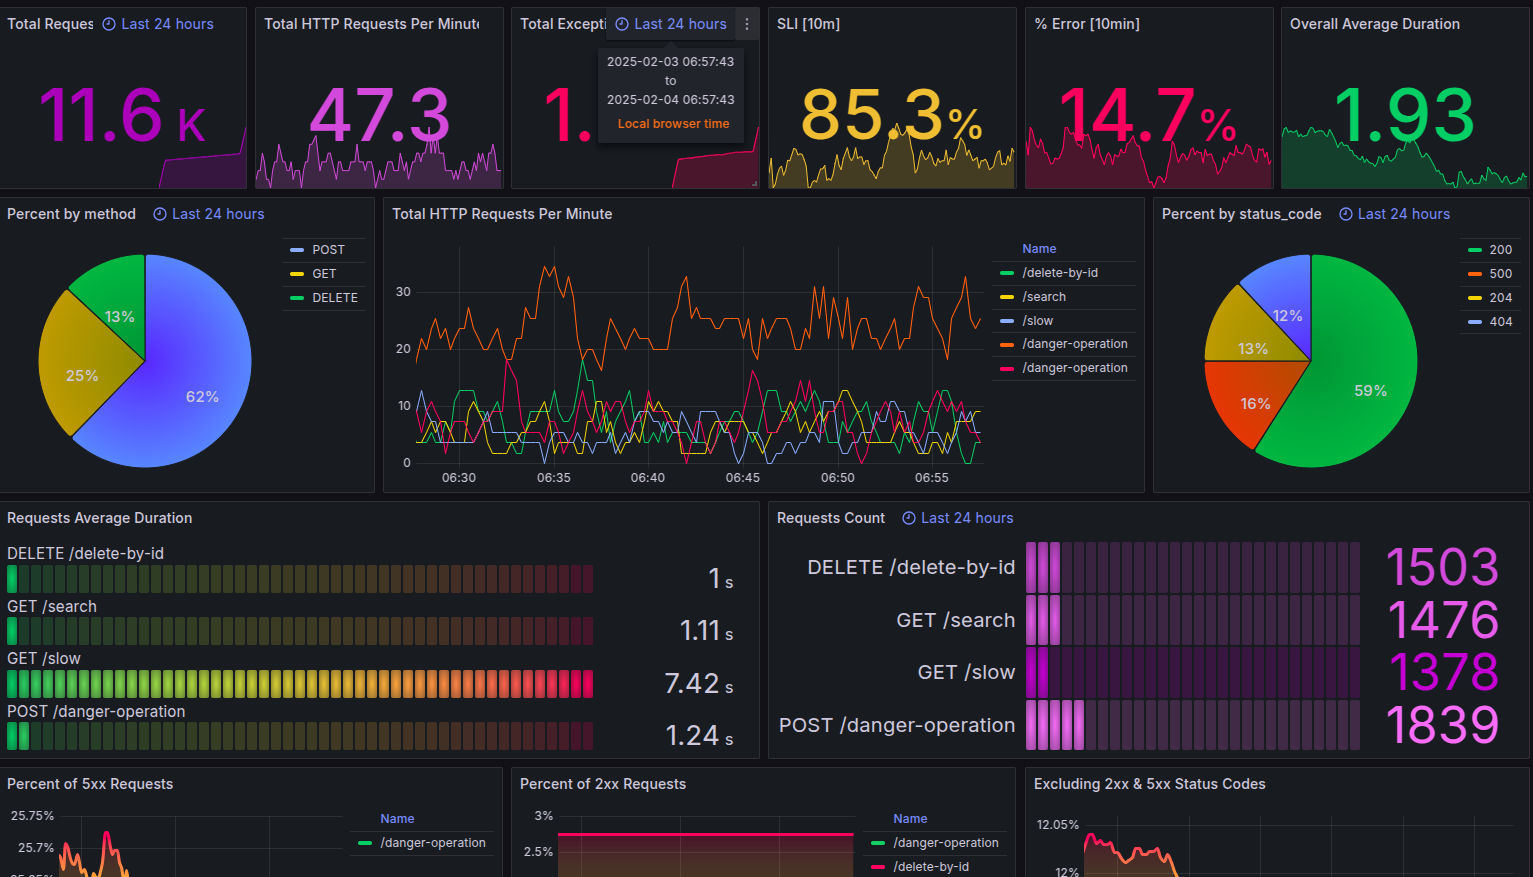
My final solution then came from the idea of using things that I already used and that were native to Windows. The result was to divide the solution into two parts. The first was to create a powershell that is capable of creating a metrics file in the Prometheus format by looking at the log file per site. This generates a file with the metrics from time to time. With this solution ready, I just registered it in the Windows task manager so that I could run it from time to time according to my needs. That’s where the second part comes in. windows_exporter has a module called textfile, which can read a file and load the metrics into the native exporter. This way, I continue using the native exporter binary pointing to the file that my native solution solves the extraction and creation of the metrics in text. The result was much better and you can check it out below.
repository: https://github.com/nochaosio/iis_exporter