blackbox_exporter or network_exporter ?
saving your time: Prometheus exporters are applications that extract data from services or processes and expose it in Prometheus format. This article provides a brief analysis of blackbox_exporter and network_exporter, highlighting their use cases and the key differences between them

Introduction #
This type of article can be somewhat controversial because there are multiple approaches to working with these exporters. My goal is to share my perspective on where each should be used and the results you can expect.
First, it’s important to clarify that we’re dealing with network exporters. While they greatly enhance observability, I believe there are more professional ways to analyze a network. That said, the insights provided by both can help reliability engineers and software engineers quickly and easily understand their environments.
So, which one should you use? My answer is simple and direct: both !!

blackbox_exporter #
The blackbox exporter allows blackbox probing of endpoints over HTTP, HTTPS, DNS, TCP, ICMP and gRPC.
As the name suggests, blackbox_exporter is designed to simulate an external user calling an endpoint within your environment. It mimics a simple user request, monitoring the availability and performance of external endpoints such as websites, APIs, or network services. Two key pieces of information it provides are SSL certificate verification and latency measurement. In short, I consider it an external probe that makes requests to something inside your environment. You can use blackbox_exporter inside or outside your main environment, the idea is that it is positioned at the source location to perform checks on a destination, analyzing a real flow.
multi-target exporter #
The Blackbox Exporter follows the multi-target exporter pattern, allowing Prometheus to probe multiple targets without requiring an agent on each one. It works by receiving targets and a query configuration as parameters, performing network probes (such as HTTP, ICMP, or DNS), and exposing the results as metrics. This approach is particularly useful for monitoring external services, network devices, and internet-facing endpoints.
To configure it, the Blackbox Exporter is deployed and set up with specific probe modules in blackbox.yml. Prometheus is then configured to send requests to it via the /probe endpoint, specifying targets dynamically. The exporter executes the probes and returns the results as Prometheus metrics, which can be used for alerting and visualization.
Ex: http://localhost:9115/probe?target=github.com&module=http_2xx&debug=true
[Prometheus] → [Blackbox Exporter] → [Target]
      ↑              |
      |              ↓
   Metrics       Probing (HTTP, ICMP, etc.)
  (Targets)
The blackbox configuration is where you put which monitoring modules you want to use, such as HTTP. The configuration of the targets themselves is in prometheus. Ex:
modules:
  http_2xx:
    prober: http
    http:
      preferred_ip_protocol: "ip4"
  http_post_2xx:
    prober: http
    http:
      method: POST
  tcp_connect:
    prober: tcp
  grpc:
    prober: grpc
    grpc:
      tls: true
      preferred_ip_protocol: "ip4"
  ssh_banner:
    prober: tcp
    tcp:
      query_response:
      - expect: "^SSH-2.0-"
      - send: "SSH-2.0-blackbox-ssh-check"
  ssh_banner_extract:
    prober: tcp
    timeout: 5s
    tcp:
      query_response:
      - expect: "^SSH-2.0-([^ -]+)(?: (.*))?$"
        labels:
        - name: ssh_version
          value: "${1}"
        - name: ssh_comments
          value: "${2}"
  icmp:
    prober: icmp
  icmp_ttl5:
    prober: icmp
    timeout: 5s
    icmp:
      ttl: 5
network_exporter #
network_exporter can also be used in more than one way, but I usually use it for an inside-out analysis. In other words, I use it to track all external dependencies of my application or any workload I’m running, be it an external API, a database, an endpoint accessed via VPN or proxy, and so on. It’s particularly useful when an external dependency goes down or when there’s a network issue along the way, like a lost ACL or hardware failure. While it doesn’t support SSL checks, some of the metrics from blackbox_exporter also exist in network_exporter 😊
Exported metrics:
ping_up Exporter state
ping_targets Number of active targets
ping_status: Ping Status
ping_rtt_seconds{type=best}: Best round trip time in seconds
ping_rtt_seconds{type=worst}: Worst round trip time in seconds
ping_rtt_seconds{type=mean}: Mean round trip time in seconds
ping_rtt_seconds{type=sum}: Sum round trip time in seconds
ping_rtt_seconds{type=sd}: Squared deviation in seconds
ping_rtt_seconds{type=usd}: Standard deviation without correction in seconds
ping_rtt_seconds{type=csd}: Standard deviation with correction (Bessel's) in seconds
ping_rtt_seconds{type=range}: Range in seconds
ping_rtt_snt_count: Packet sent count total
ping_rtt_snt_fail_count: Packet sent fail count total
ping_rtt_snt_seconds: Packet sent time total in seconds
ping_loss_percent: Packet loss in percent
mtr_up Exporter state
mtr_targets Number of active targets
mtr_hops Number of route hops
mtr_rtt_seconds{type=last}: Last round trip time in seconds
mtr_rtt_seconds{type=best}: Best round trip time in seconds
mtr_rtt_seconds{type=worst}: Worst round trip time in seconds
mtr_rtt_seconds{type=mean}: Mean round trip time in seconds
mtr_rtt_seconds{type=sum}: Sum round trip time in seconds
mtr_rtt_seconds{type=sd}: Squared deviation in seconds
mtr_rtt_seconds{type=usd}: Standard deviation without correction in seconds
mtr_rtt_seconds{type=csd}: Standard deviation with correction (Bessel's) in seconds
mtr_rtt_seconds{type=range}: Range in seconds
mtr_rtt_seconds{type=loss}: Packet loss in percent
mtr_rtt_snt_count: Packet sent count total
mtr_rtt_snt_fail_count: Packet sent fail count total
mtr_rtt_snt_seconds: Packet sent time total in seconds
tcp_up Exporter state
tcp_targets Number of active targets
tcp_connection_status Connection Status
tcp_connection_seconds Connection time in seconds
http_get_up Exporter state
http_get_targets Number of active targets
http_get_status HTTP Status Code and Connection Status
http_get_content_bytes HTTP Get Content Size in bytes
http_get_seconds{type=DNSLookup}: DNSLookup connection drill down time in seconds
http_get_seconds{type=TCPConnection}: TCPConnection connection drill down time in seconds
http_get_seconds{type=TLSHandshake}: TLSHandshake connection drill down time in seconds
http_get_seconds{type=TLSEarliestCertExpiry}: TLSEarliestCertExpiry cert expiration time in epoch
http_get_seconds{type=TLSLastChainExpiry}: TLSLastChainExpiry cert expiration time in epoch
http_get_seconds{type=ServerProcessing}: ServerProcessing connection drill down time in seconds
http_get_seconds{type=ContentTransfer}: ContentTransfer connection drill down time in seconds
http_get_seconds{type=Total}: Total connection time in seconds
PoC #
This PoC showcases monitoring in a Kubernetes environment using network_exporter to analyze connectivity from inside out and blackbox_exporter to simulate external access and assess service availability from outside in.
The dependencies of my application, which is behind a service, are a database and an external API. I want information about both
network_exporter  --> Database
                  --> External api
                  --> Partner website
To check if my API is working as expected, I will make a request using blackbox_exporter, simulating an HTTP call
blackbox_exporter  --> Ingress
                   --> Partner website
what are we going to build #
You will test the connectivity and performance of services within a Kubernetes cluster using Blackbox Exporter and Network Exporter to monitor interactions between pods, an external API, and a database, including traffic through an Ingress and Service.
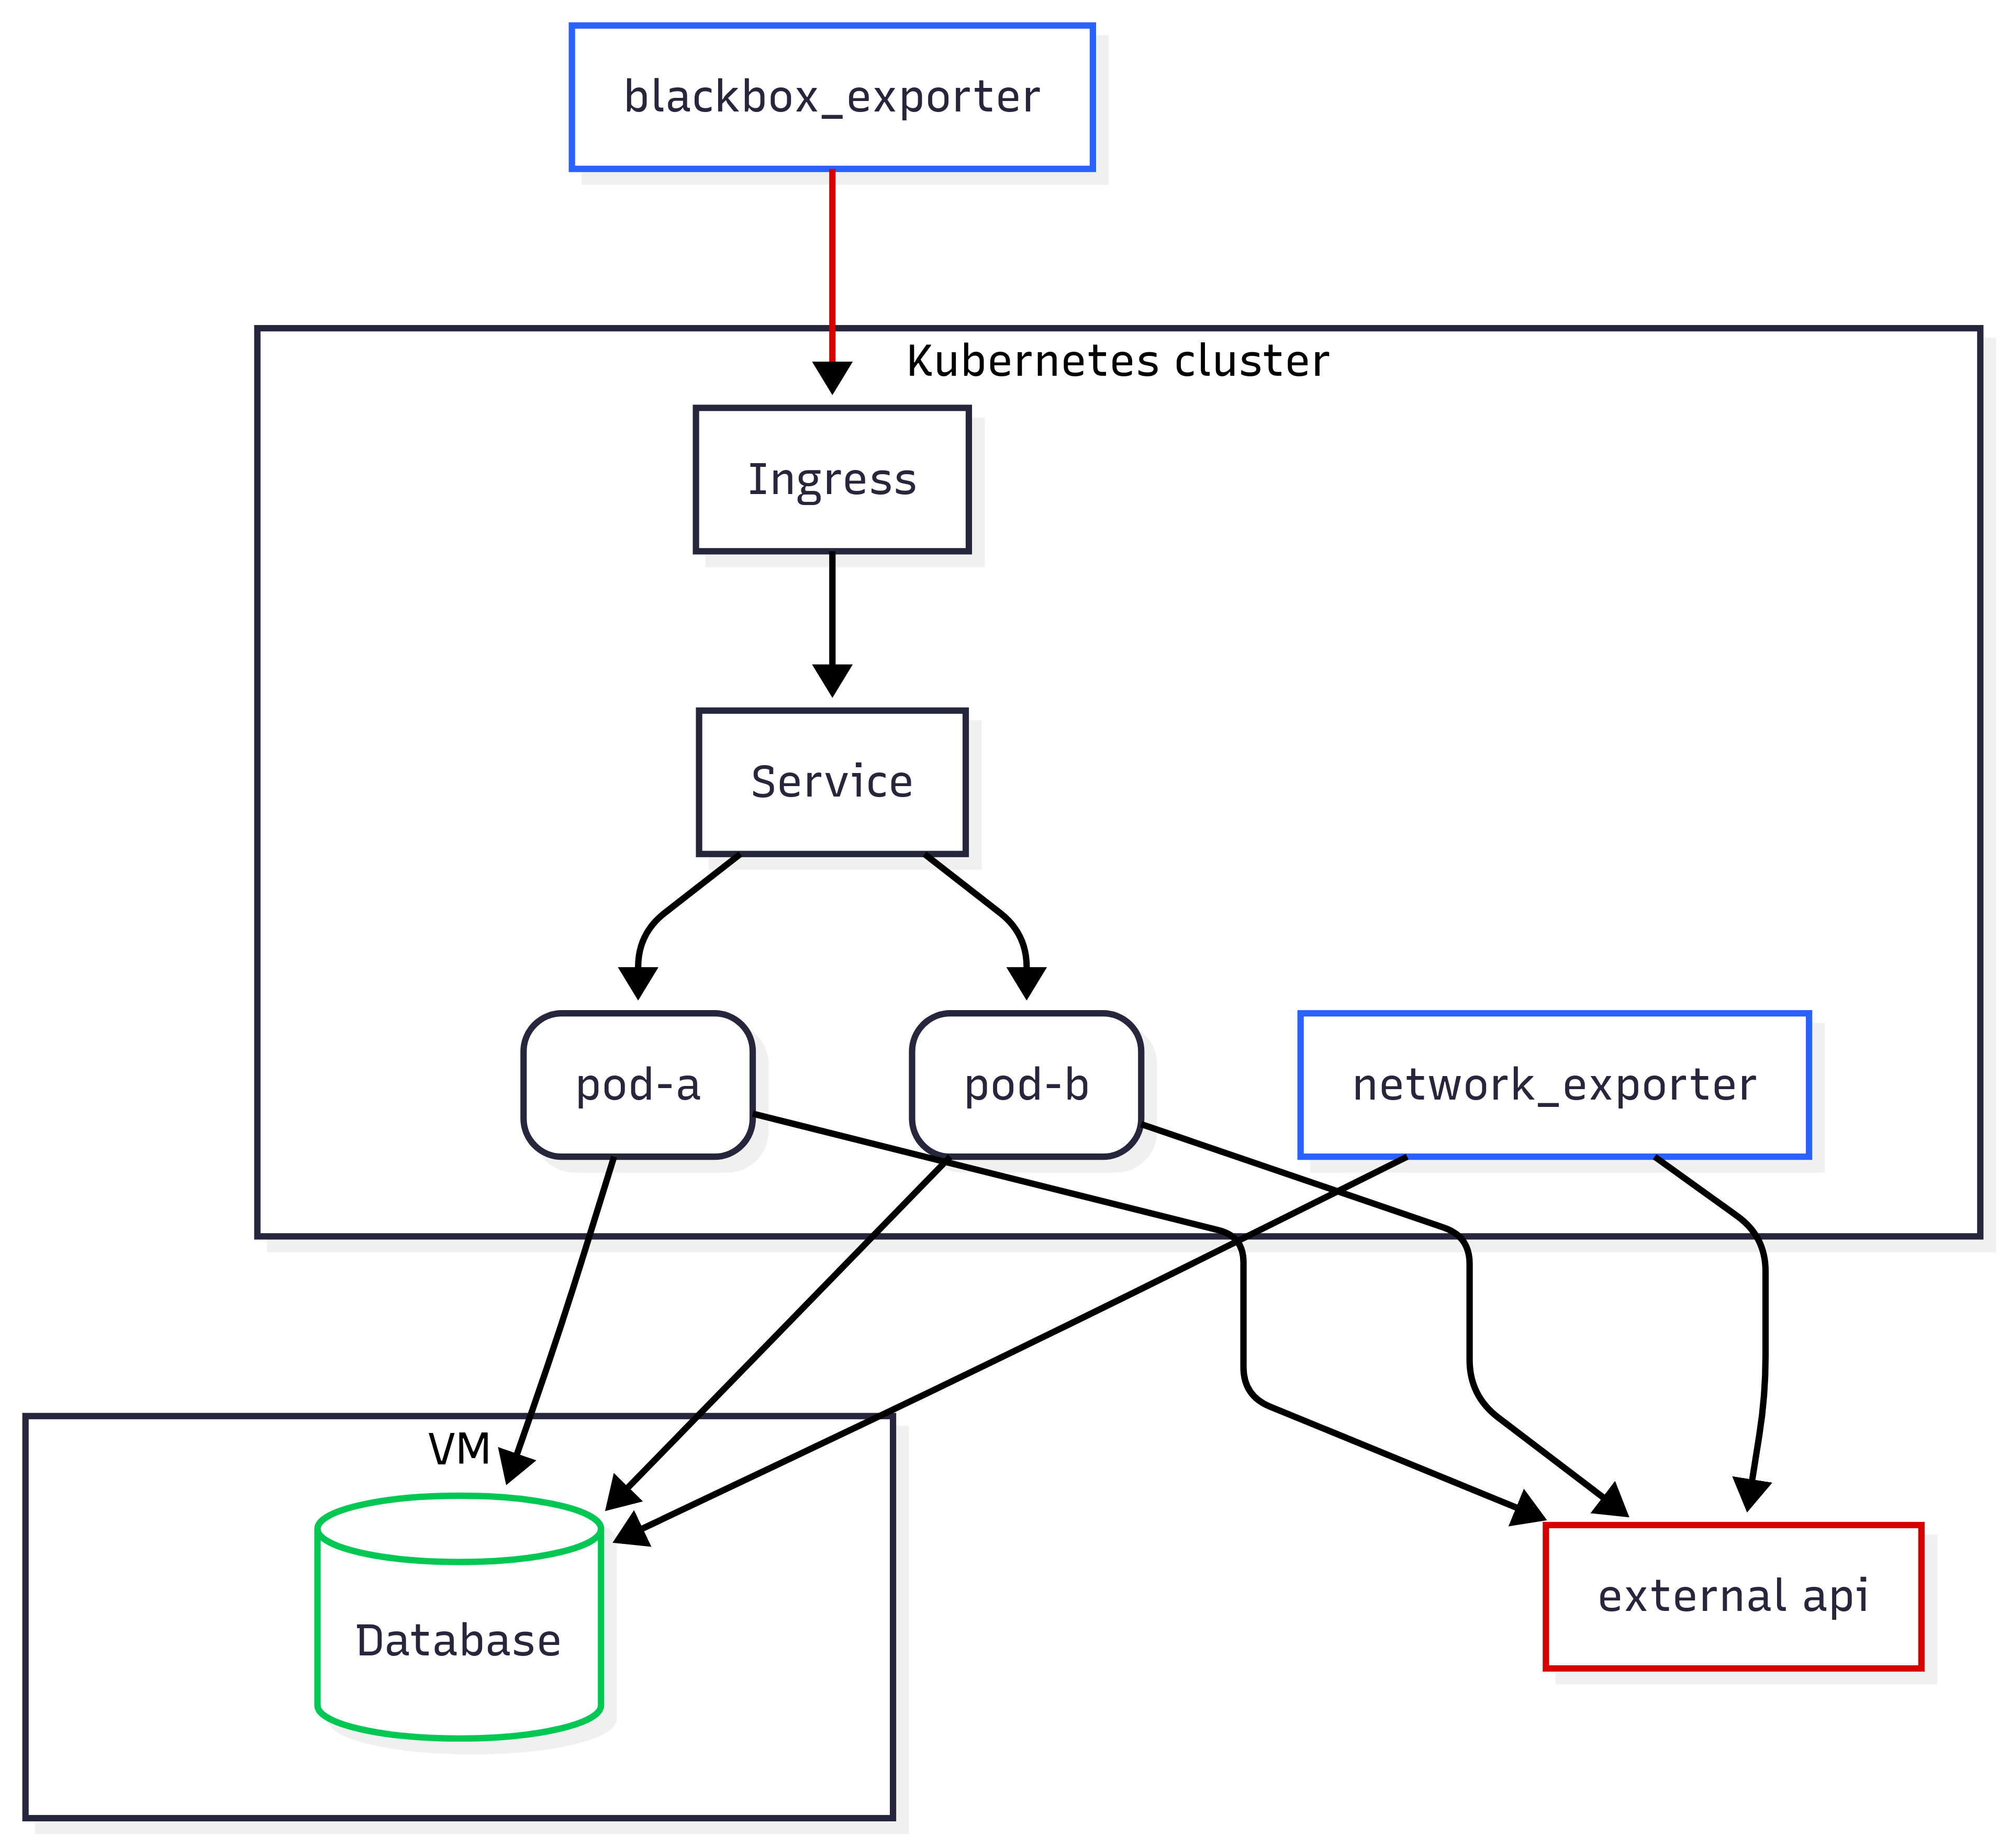
flowchart TB
 subgraph subGraph0["Kubernetes cluster"]
        poda("pod-a")
        podb("pod-b")
        Service["Service"]
        network_exporter["network_exporter"]
        Ingress["Ingress"]
  end
 subgraph subGraph1["VM"]
        DB[("Database")]
  end
    Ingress --> Service
    Service --> poda & podb
    poda --> DB & external["external api"]
    podb --> DB & external
    blackbox_exporter["blackbox_exporter"] --> Ingress
    network_exporter --> external & DB
    style network_exporter stroke:#2962FF
    style DB stroke:#00C853
    style external stroke:#D50000
    style blackbox_exporter stroke:#2962FF
    linkStyle 7 stroke:#D50000,fill:none
Creating a local Kubernetes environment #
kind: Cluster
apiVersion: kind.x-k8s.io/v1alpha4
nodes:
- role: worker
- role: worker
- role: control-plane
  kubeadmConfigPatches:
  - |
    kind: InitConfiguration
    nodeRegistration:
      kubeletExtraArgs:
        node-labels: "ingress-ready=true"
        authorization-mode: "AlwaysAllow"
  extraPortMappings:
  - containerPort: 80
    hostPort: 80
    protocol: TCP
  - containerPort: 443
    hostPort: 443
    protocol: TCP
Instructions #
All details can be found in this repository.Follow the step by step instructions in the README
Creating a basic view in grafana #
References #
https://github.com/syepes/network_exporter
https://github.com/prometheus/blackbox_exporter
https://github.com/prometheus/blackbox_exporter/blob/master/CONFIGURATION.md
https://grafana.com/grafana/dashboards/15297-prometheus-network-exporter/